PV Safety Cloud Platform
Turns "which module is the problem" from a guess into a traceable record. Every module's voltage, current, temperature and conduction state is archived in full; the array heatmap pinpoints anomalies at a glance; five AI diagnostics compress fault discovery from day-scale inspection to second-scale exposure.
From seeing data to understanding it
Most platforms hand you a wall of curves. The hard part is telling you which curve fails tomorrow.
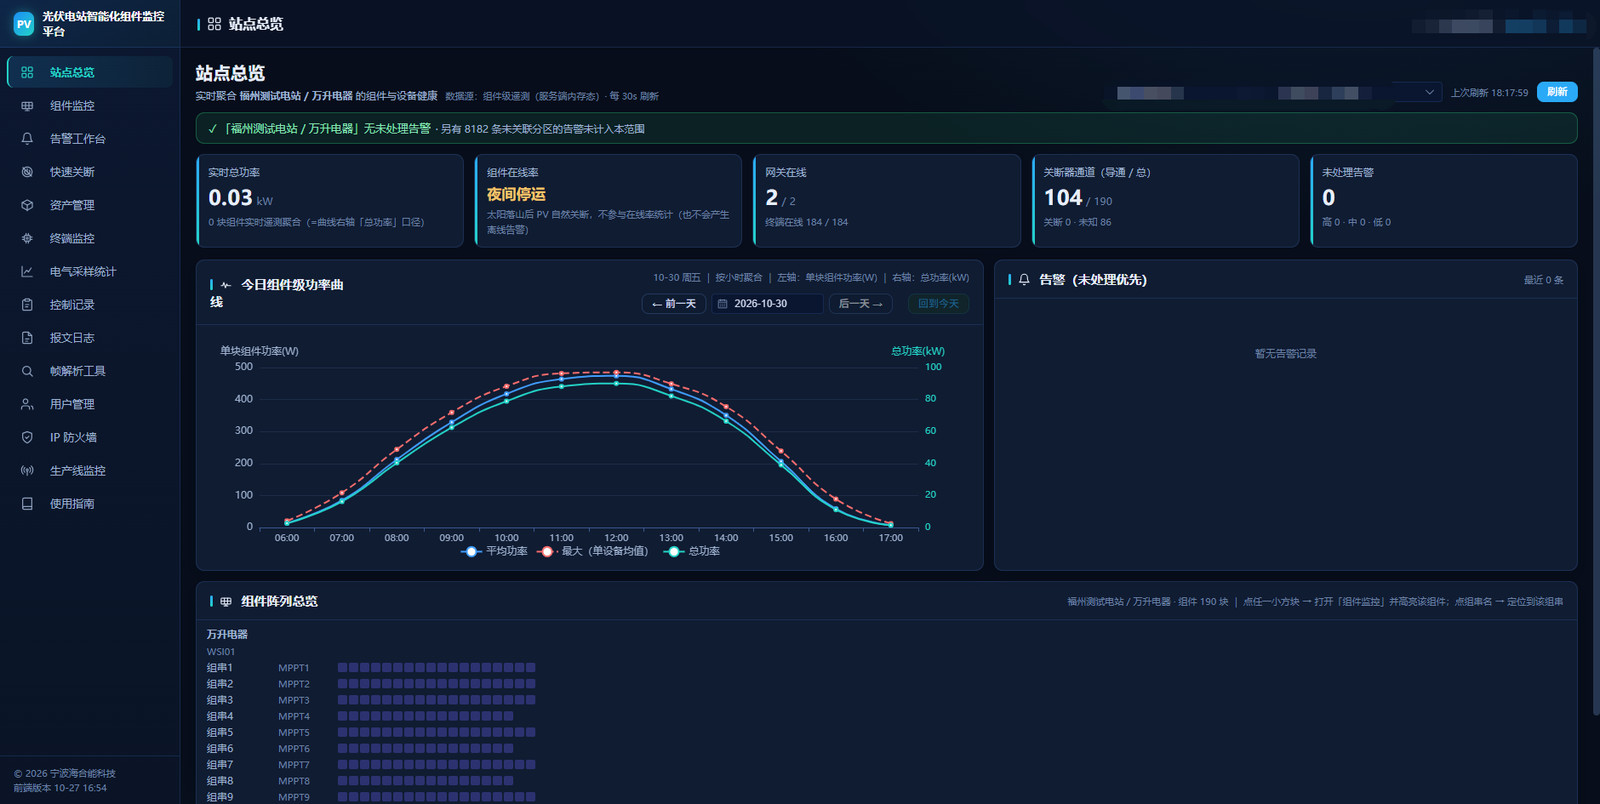
Site overview
Device status, online rate, PR and operating summary per project, comparable across sites on one screen.
Module archive
Voltage, current, temperature and conduction state retained per module, traceable to serial number.
Array heatmap
Status distribution laid out on the actual roof geometry — anomalies visible without opening each node.
LDSW network view
Link quality, online devices and communication success rate in real time — no more guessing at network issues.
Writing veteran know-how into models
Once module-level data density is high enough, many faults previously found only by sending someone onto the roof become visible in the data first.
From site overview all the way down to a single module
This is not a mock-up — it is the live interface. The left rail drills from plant to zone to inverter to string. Pick any module on the right and its serial number, live voltage and current, temperature, link status and latest alarms appear in one panel.
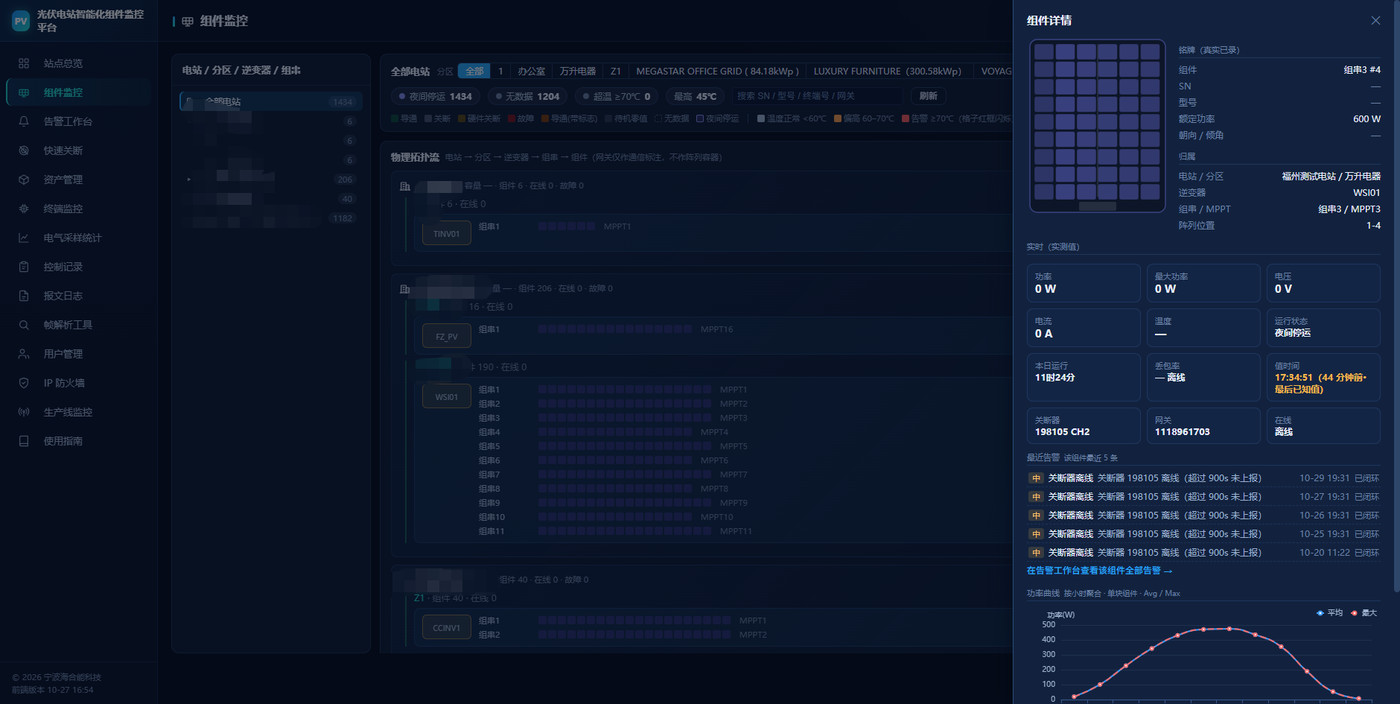
Live interface · module monitoring and single-module record (captured from a test site at night, in standby — hence zero live power and current readings)
Layout mirrors the real roof
The array view follows the actual physical positions of modules. Faulty modules are highlighted in place, so nobody hunts by serial number.
Drill without detours
Plant → zone → inverter → MPPT → string → module. Every level shows online and abnormal counts.
A complete module record
Serial number, rated power, live voltage / current / temperature, communication channel and the last five alarms, all on one panel.
One platform, four views
Management wants summary, O&M wants tickets, delivery wants commissioning, owners want reporting. Views are assigned by role so nobody has to compromise.
| Role | Focus | What the platform provides |
|---|---|---|
| Management / owner | Portfolio distribution, online rate, PR, overall safety posture | Multi-site dashboard, monthly safety report, exportable compliance records |
| O&M team | Alarm handling, work orders, fault localisation | Alarm grading and closure, ticket workflow, module-level location with actions |
| Delivery team | Device onboarding, parameter checks, commissioning | Batch binding, threshold configuration, link self-test, commissioning record export |
| Safety officer | Emergency shutdown, audit trail, liability demarcation | One-click shutdown, operation audit log, event timeline reconstruction |
The platform is not an island — it closes the three-layer chain
Down to the hardware
- Ingests full module-level data from HiSRSD shutdown devices
- Organises the LDSW network through the Smart Network Controller
- Pushes shutdown commands, thresholds and firmware to terminals
- Shares one O&M entry point with the CS-500 storage suppression system
Up to decision making
- Generates safety ledgers and compliance reports ready for board reporting
- Alarm closure records support liability demarcation
- Historical data export supports insurance and audit workflows
- Open interfaces for integration with existing O&M systems
Run it on your own site data first, then decide
Demo environment trials and live site data onboarding available, together with safety-ledger templates and acceptance criteria design.